Observability
Istio generates the following types of telemetry in order to provide overall service mesh observability:
- Metrics. Istio generates a set of service metrics based on the four “golden signals” of monitoring (latency, traffic, errors, and saturation). Istio also provides detailed metrics for the . A default set of mesh monitoring dashboards built on top of these metrics is also provided.
- Access Logs. As traffic flows into a service within a mesh, Istio can generate a full record of each request, including source and destination metadata. This information enables operators to audit service behavior down to the individual level.
Metrics provide a way of monitoring and understanding behavior in aggregate.
To monitor service behavior, Istio generates metrics for all service traffic in, out, and within an Istio service mesh. These metrics provide information on behaviors such as the overall volume of traffic, the error rates within the traffic, and the response times for requests.
In addition to monitoring the behavior of services within a mesh, it is also important to monitor the behavior of the mesh itself. Istio components export metrics on their own internal behaviors to provide insight on the health and function of the mesh control plane.
Istio metrics collection begins with the sidecar proxies (Envoy). Each proxy generates a rich set of metrics about all traffic passing through the proxy (both inbound and outbound). The proxies also provide detailed statistics about the administrative functions of the proxy itself, including configuration and health information.
Envoy-generated metrics provide monitoring of the mesh at the granularity of Envoy resources (such as listeners and clusters). As a result, understanding the connection between mesh services and Envoy resources is required for monitoring the Envoy metrics.
Istio enables operators to select which of the Envoy metrics are generated and collected at each workload instance. By default, Istio enables only a small subset of the Envoy-generated statistics to avoid overwhelming metrics backends and to reduce the CPU overhead associated with metrics collection. However, operators can easily expand the set of collected proxy metrics when required. This enables targeted debugging of networking behavior, while reducing the overall cost of monitoring across the mesh.
The Envoy documentation site includes a detailed overview of . The operations guide on Envoy Statistics provides more information on controlling the generation of proxy-level metrics.
Example proxy-level Metrics:
In addition to the proxy-level metrics, Istio provides a set of service-oriented metrics for monitoring service communications. These metrics cover the four basic service monitoring needs: latency, traffic, errors, and saturation. Istio ships with a default set of for monitoring service behaviors based on these metrics.
The standard Istio metrics are exported to by default.
Example service-level metric:
The Istio control plane also provides a collection of self-monitoring metrics. These metrics allow monitoring of the behavior of Istio itself (as distinct from that of the services within the mesh).
For more information on which metrics are maintained, please refer to the reference documentation.
Distributed tracing provides a way to monitor and understand behavior by monitoring individual requests as they flow through a mesh. Traces empower mesh operators to understand service dependencies and the sources of latency within their service mesh.
Istio supports distributed tracing through the Envoy proxies. The proxies automatically generate trace spans on behalf of the applications they proxy, requiring only that the applications forward the appropriate request context.
Istio supports a number of tracing backends, including , Jaeger, , and Datadog. Operators control the sampling rate for trace generation (that is, the rate at which tracing data is generated per request). This allows operators to control the amount and rate of tracing data being produced for their mesh.
More information about Distributed Tracing with Istio is found in our .
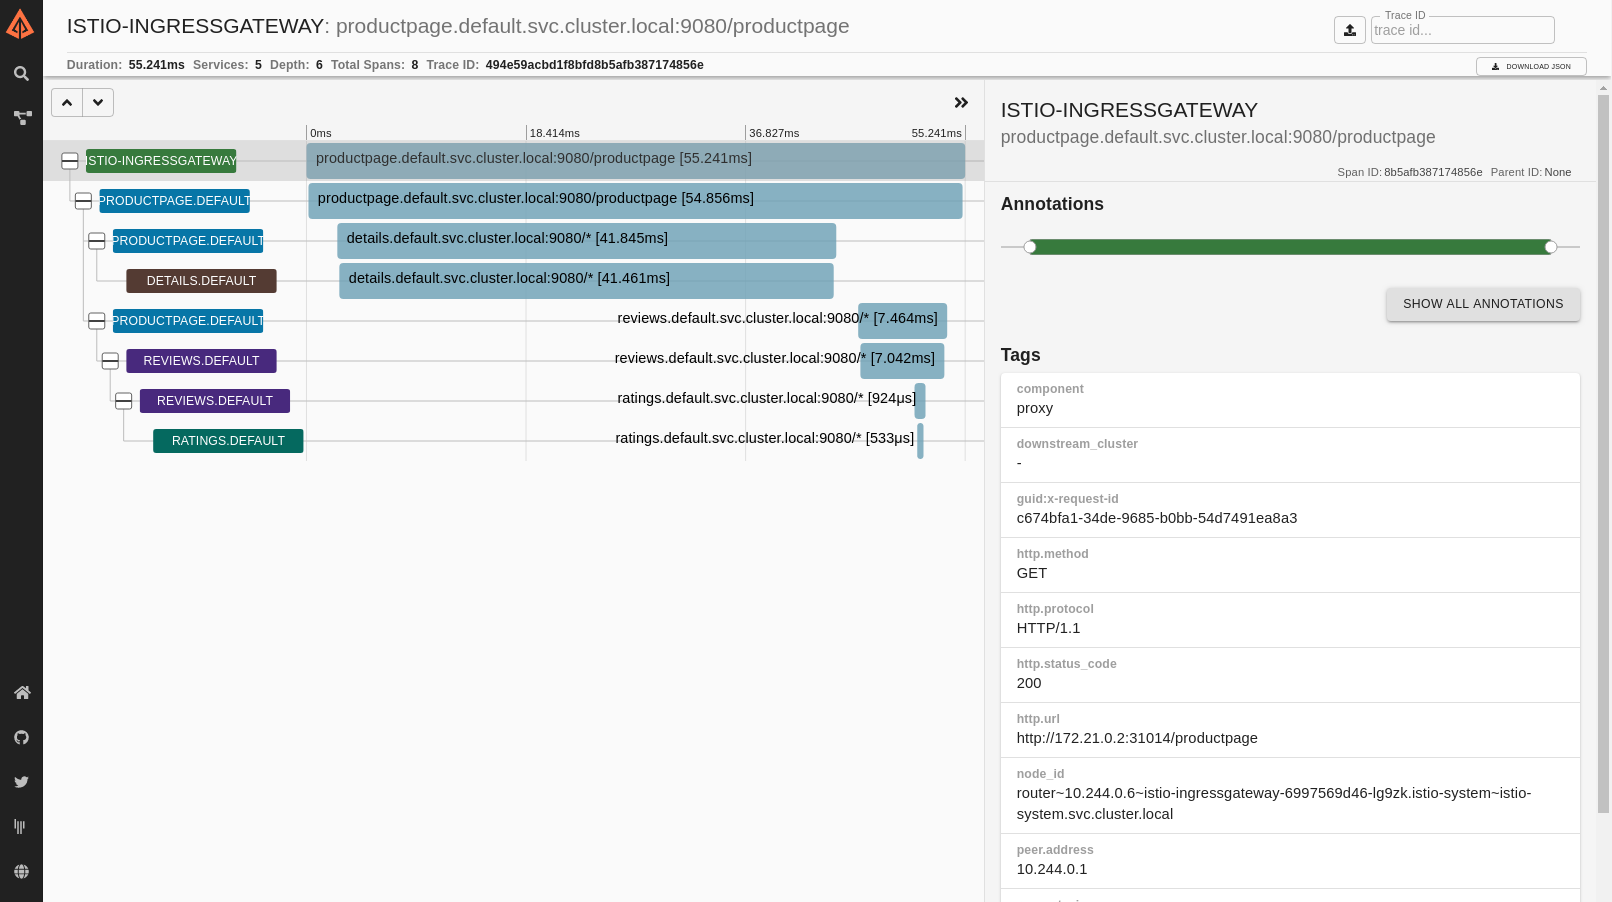
Example Istio-generated distributed trace for a single request:
Distributed Trace for a single request
Access logs provide a way to monitor and understand behavior from the perspective of an individual workload instance.
Example Istio access log:
Improving availability and reducing latency.
Provides an overview of Mixer’s plug-in architecture.
A new way to manage installation of telemetry addons.
App Identity and Access Adapter
Using Istio to secure multi-cloud Kubernetes applications with zero code changes.
This task shows you how to improve telemetry by grouping requests and responses by their type.
This task shows you how to configure Istio to collect metrics for TCP services.
