
Visualizing Metrics with Grafana
The sample application is used as the example application throughout this task.
- Install Istio in your cluster.
- Install the .
- Deploy the Bookinfo application.
Verify that the service is running in your cluster.
In Kubernetes environments, execute the following command:
Verify that the Grafana service is running in your cluster.
In Kubernetes environments, execute the following command:
Open the Istio Dashboard via the Grafana UI.
In Kubernetes environments, execute the following command:
Visit in your web browser.
The Istio Dashboard will look similar to:
Istio Dashboard
Visualize Service Dashboards.
From the Grafana dashboard’s left hand corner navigation menu, you can navigate to Istio Service Dashboard or visit in your web browser.
You may need to select a service in the Service dropdown.
The Istio Service Dashboard will look similar to:
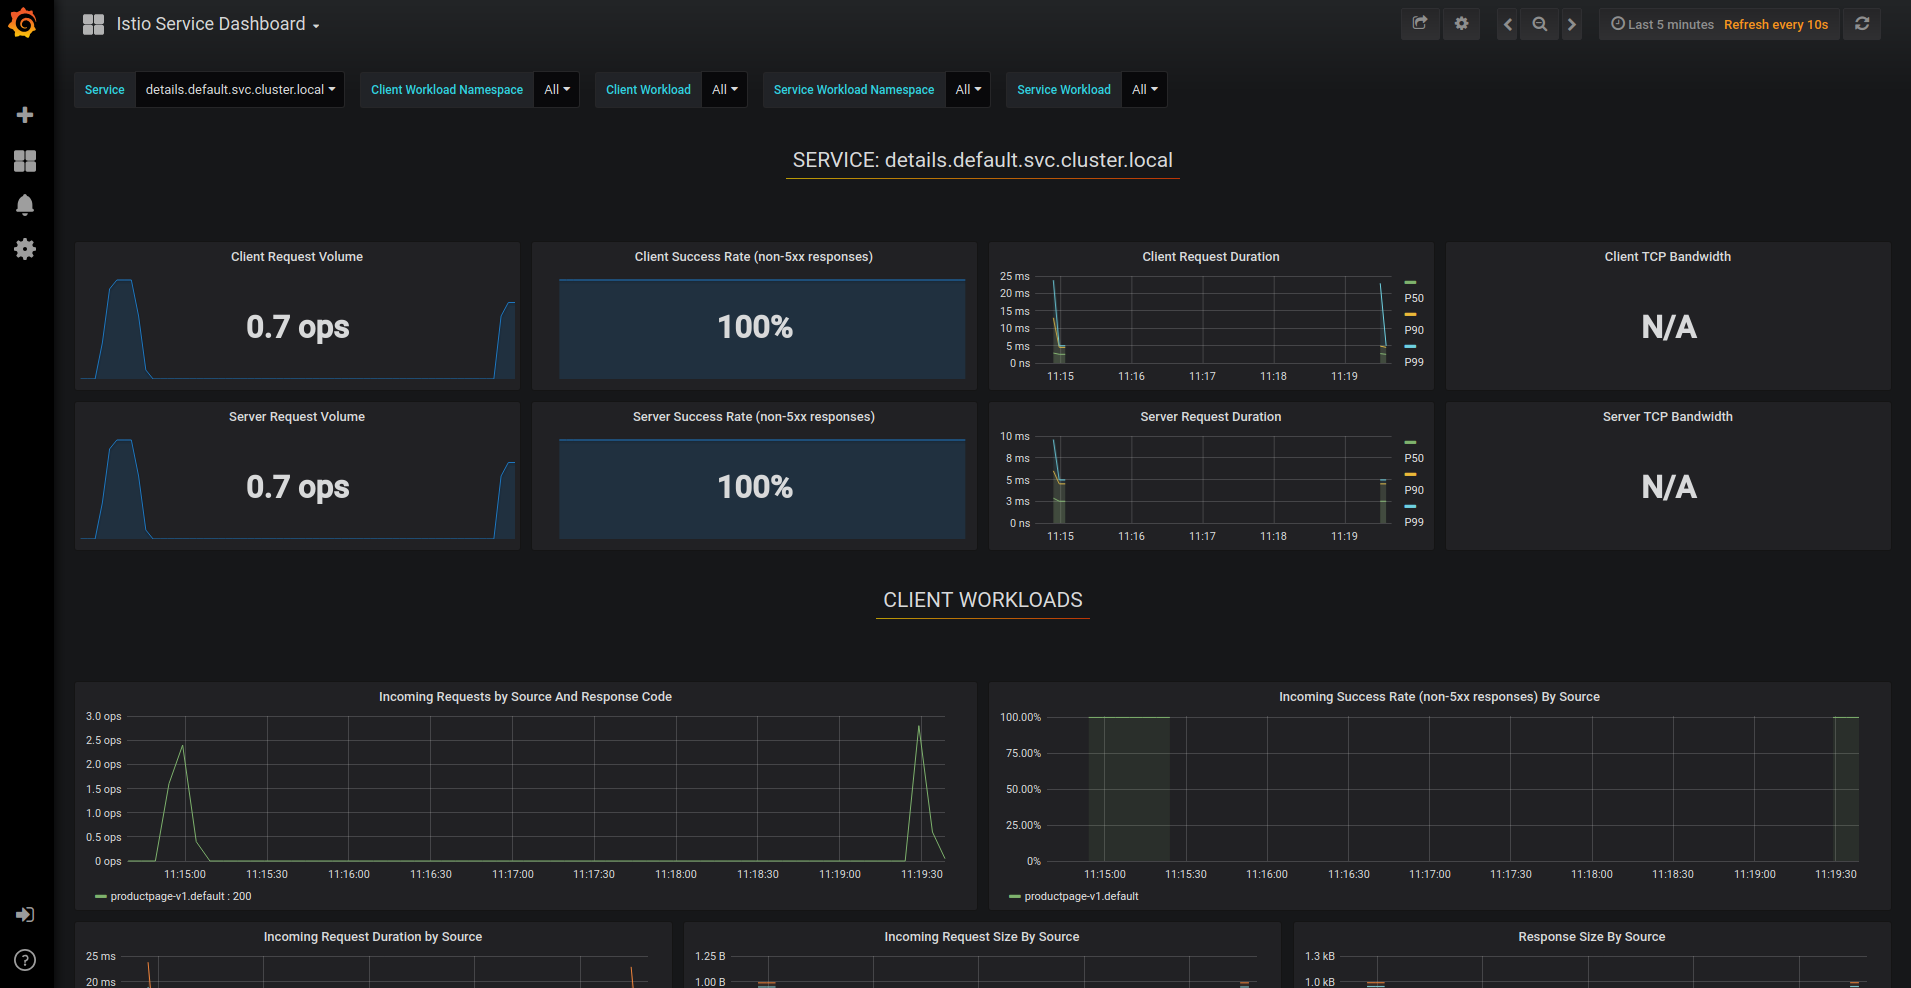
This gives details about metrics for the service and then client workloads (workloads that are calling this service) and service workloads (workloads that are providing this service) for that service.
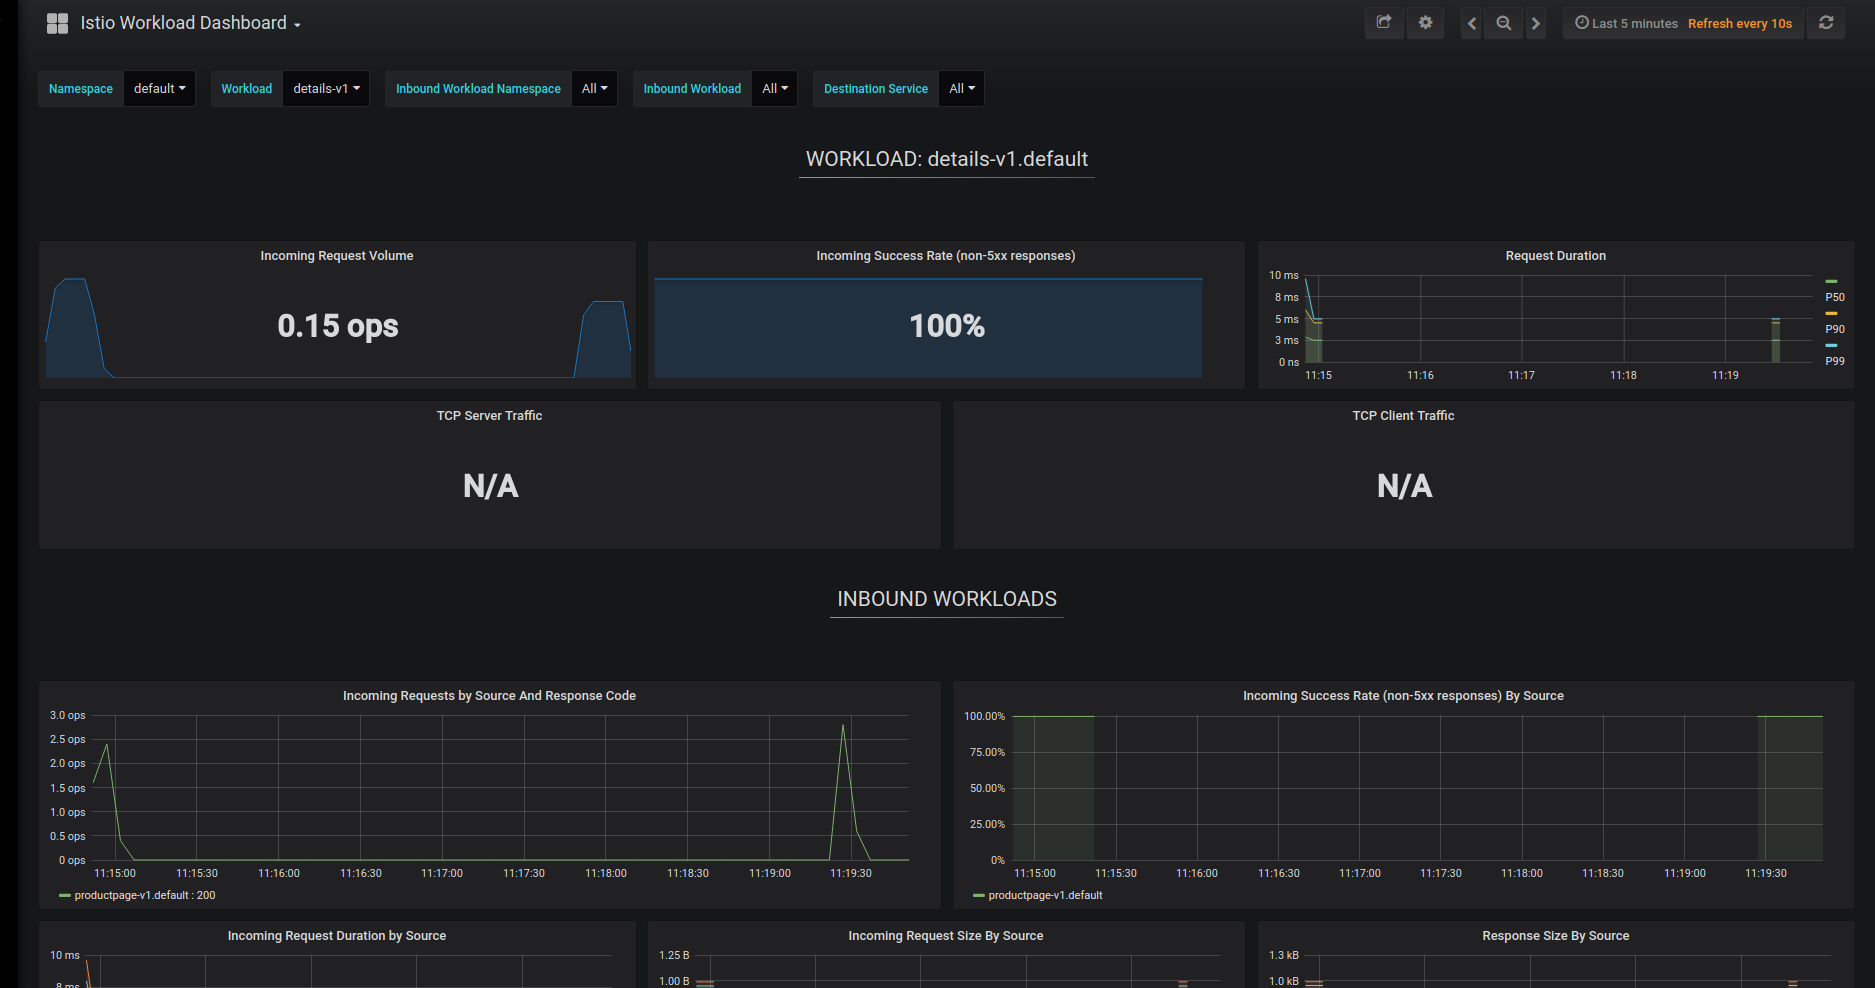
Visualize Workload Dashboards.
From the Grafana dashboard’s left hand corner navigation menu, you can navigate to Istio Workload Dashboard or visit in your web browser.
The Istio Workload Dashboard will look similar to:
Istio Workload Dashboard
This gives details about metrics for each workload and then inbound workloads (workloads that are sending request to this workload) and outbound services (services to which this workload send requests) for that workload.

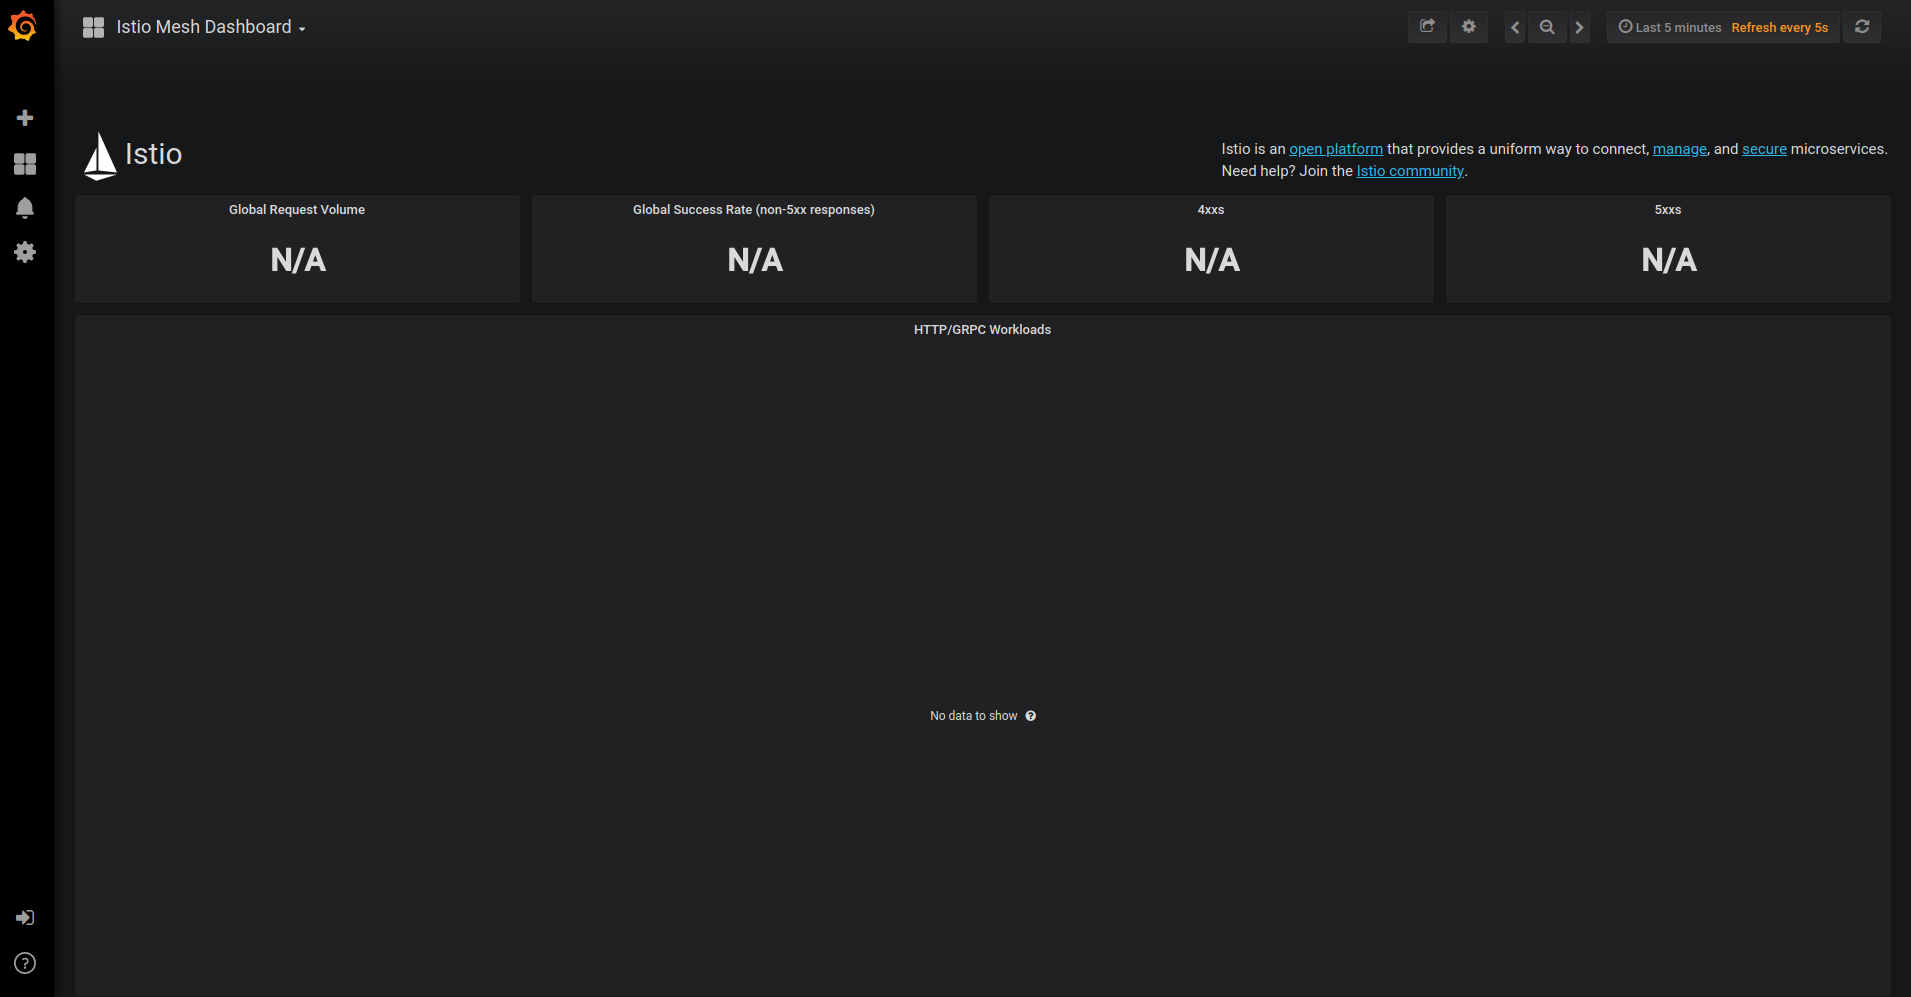
The Istio Dashboard consists of three main sections:
A Mesh Summary View. This section provides Global Summary view of the Mesh and shows HTTP/gRPC and TCP workloads in the Mesh.
Individual Services View. This section provides metrics about requests and responses for each individual service within the mesh (HTTP/gRPC and TCP). This also provides metrics about client and service workloads for this service.
Individual Workloads View: This section provides metrics about requests and responses for each individual workload within the mesh (HTTP/gRPC and TCP). This also provides metrics about inbound workloads and outbound services for this workload.
For more on how to create, configure, and edit dashboards, please see the .
If you are not planning to explore any follow-on tasks, refer to the Bookinfo cleanup instructions to shutdown the application.

