
Querying Metrics from Prometheus
The sample application is used as the example application throughout this task.
- Install Istio in your cluster.
- Install the .
Verify that the service is running in your cluster.
In Kubernetes environments, execute the following command:
Send traffic to the mesh.
For the Bookinfo sample, visit
http://$GATEWAY_URL/productpagein your web browser or issue the following command:$ curl "http://$GATEWAY_URL/productpage"
$GATEWAY_URLis the value set in the Bookinfo example.Open the Prometheus UI.
In Kubernetes environments, execute the following command:
Execute a Prometheus query.
In the “Expression” input box at the top of the web page, enter the text:
Then, click the Execute button.
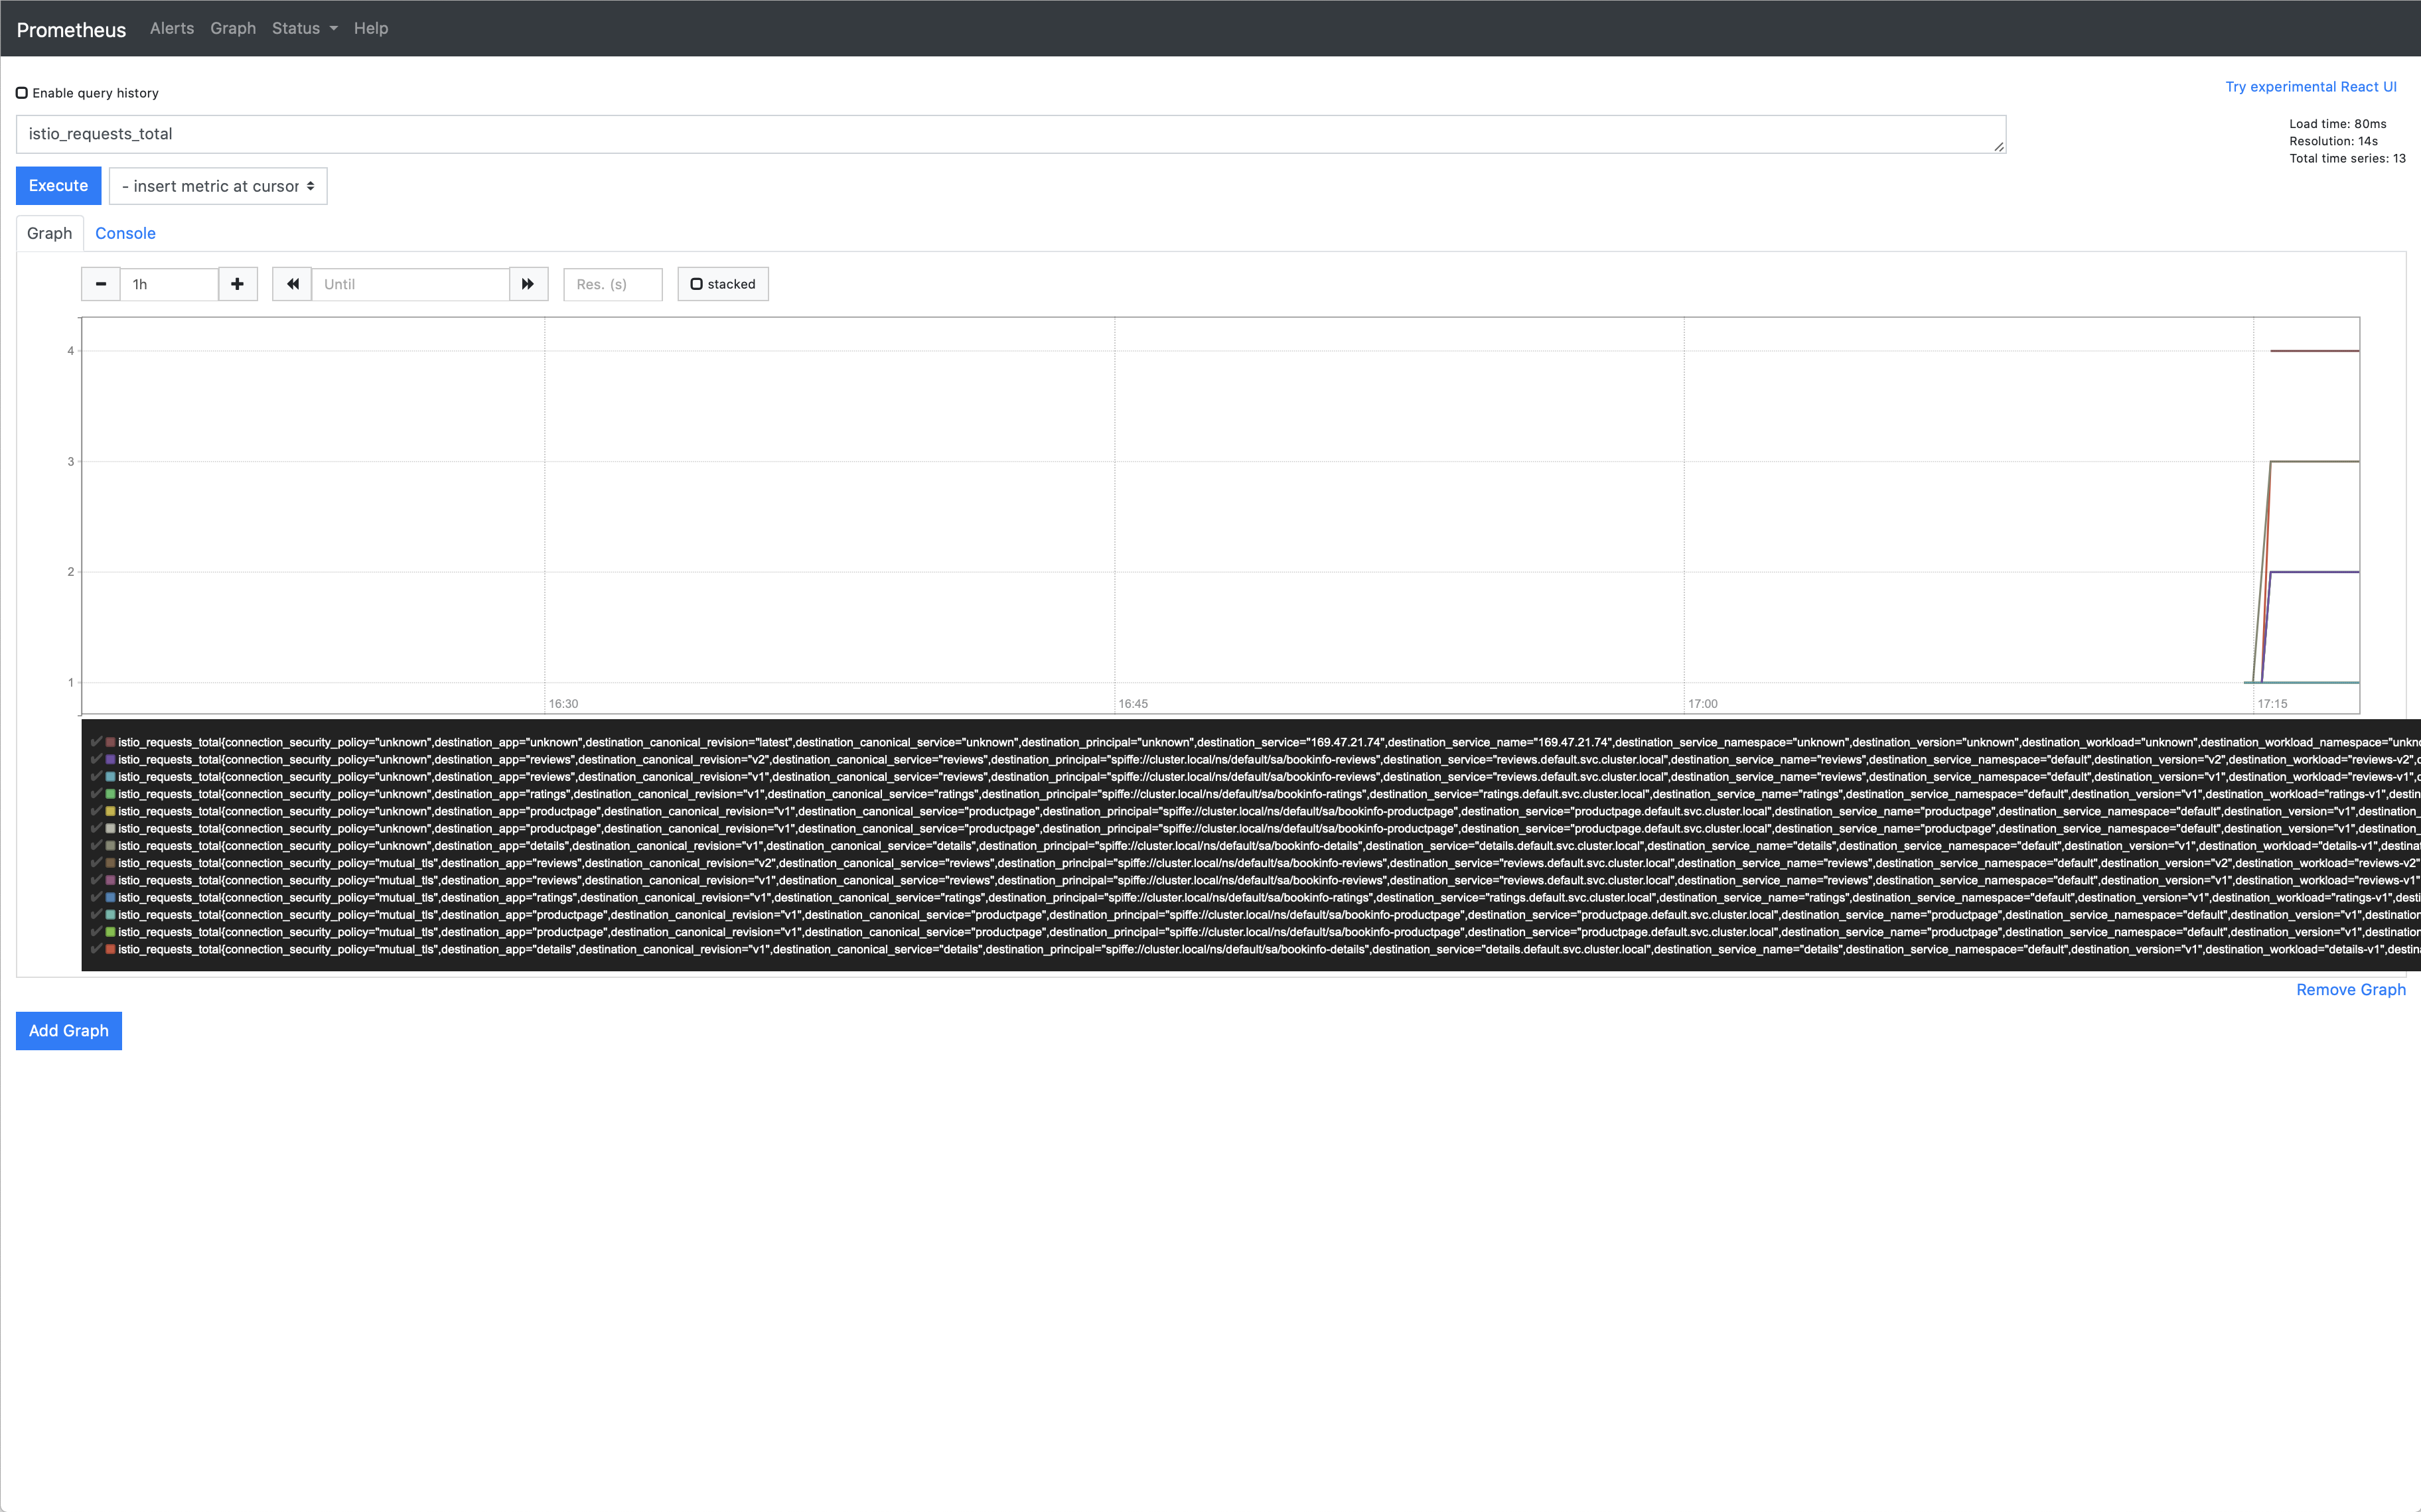
The results will be similar to:
Prometheus Query Result
You can also see the query results graphically by selecting the Graph tab underneath the Execute button.
Other queries to try:
Total count of all requests to
v3of thereviewsservice:This query returns the current total count of all requests to the v3 of the
reviewsservice.Rate of requests over the past 5 minutes to all instances of the
productpageservice:
The Prometheus addon is a Prometheus server that comes preconfigured to scrape Istio endpoints to collect metrics. It provides a mechanism for persistent storage and querying of Istio metrics.
For more on querying Prometheus, please read their .
Remove any
istioctlprocesses that may still be running using control-C or:

