
Lightstep
If you only want to collect tracing spans directly from Istio (and not add specific instrumentation directly to your code), then you don’t need to configure any tracers, as long as your services forward the .
This task uses the Bookinfo sample application as an example.
Ensure you have a Lightstep account. for a free trial of Lightstep.
If you’re using on-premise Satellites, ensure you have a satellite pool configured with TLS certs and a secure GRPC port exposed. See for details about setting up satellites.
For Lightstep Public Satellites or , your satellites are already configured. However you need to download this certificate to a local directory.
Ensure sure you have a Lightstep . Access tokens allow your app to communicate with your Lightstep project.
Deploy Istio
How you deploy Istio depends on which type of Satellite you use.
These instructions do not assume TLS. If you are using TLS for your Satellite pool, follow the config for the Public Satellite pool, but use your own cert and your own pool’s endpoint ().
You need to deploy Istio with your Satellite address at an address in the format
<Host>:<Port>, for examplelightstep-satellite.lightstep:9292. You find this in your file.Deploy Istio with the following configuration parameters specified:
pilot.traceSampling=100global.proxy.tracer="lightstep"global.tracer.lightstep.address="<satellite-address>"global.tracer.lightstep.accessToken="<access-token>"
You can set these parameters using the
--set key=valuesyntax when you run the install command. For example:
Deploy Istio with Public or Developer Mode Satellites
Follow these steps if you’re using the Public or Developer Mode Satellites, or if you’re using on-premise Satellites with a TLS certificate.
-
$ CACERT=$(cat Cert_Auth.crt | base64) # Cert_Auth.crt contains the necessary CACert$ NAMESPACE=default
Deploy Istio with the following configuration parameters specified:
global:proxy:tracer:lightstep:address: "ingest.lightstep.com:443"accessToken: "<access-token>"meshConfig:tracing:sampling: 100tlsSettingsmode: "SIMPLE"# Specifying ca certificate here will moute `lightstep.cacert` secret volume# at all sidecars by default.caCertificates="/etc/lightstep/cacert.pem"components:ingressGateways:# `lightstep.cacert` secret volume needs to be mount at gateways via k8s overlay.- name: istio-ingressgatewayenabled: truek8s:overlays:- kind: Deploymentname: istio-ingressgatewaypatches:name: lightstep-certsmountPath: /etc/lightstepreadOnly: true- path: spec.template.spec.volumes[-1]value: |name: lightstep-certssecret:secretName: lightstep.cacertoptional: true
Follow the instructions to deploy the Bookinfo sample application.
Follow the .
To verify the previous step’s success, confirm that you set
GATEWAY_URLenvironment variable in your shell.Send traffic to the sample application.
Visualize trace data
Load the Lightstep web UI. You’ll see the three Bookinfo services listed in the Service Directory.
Bookfinder services in the Service Directory
Navigate to the Explorer view.
Explorer view
Find the query bar at the top. The query bar allows you to interactively filter results by a Service, Operation, and Tag values.
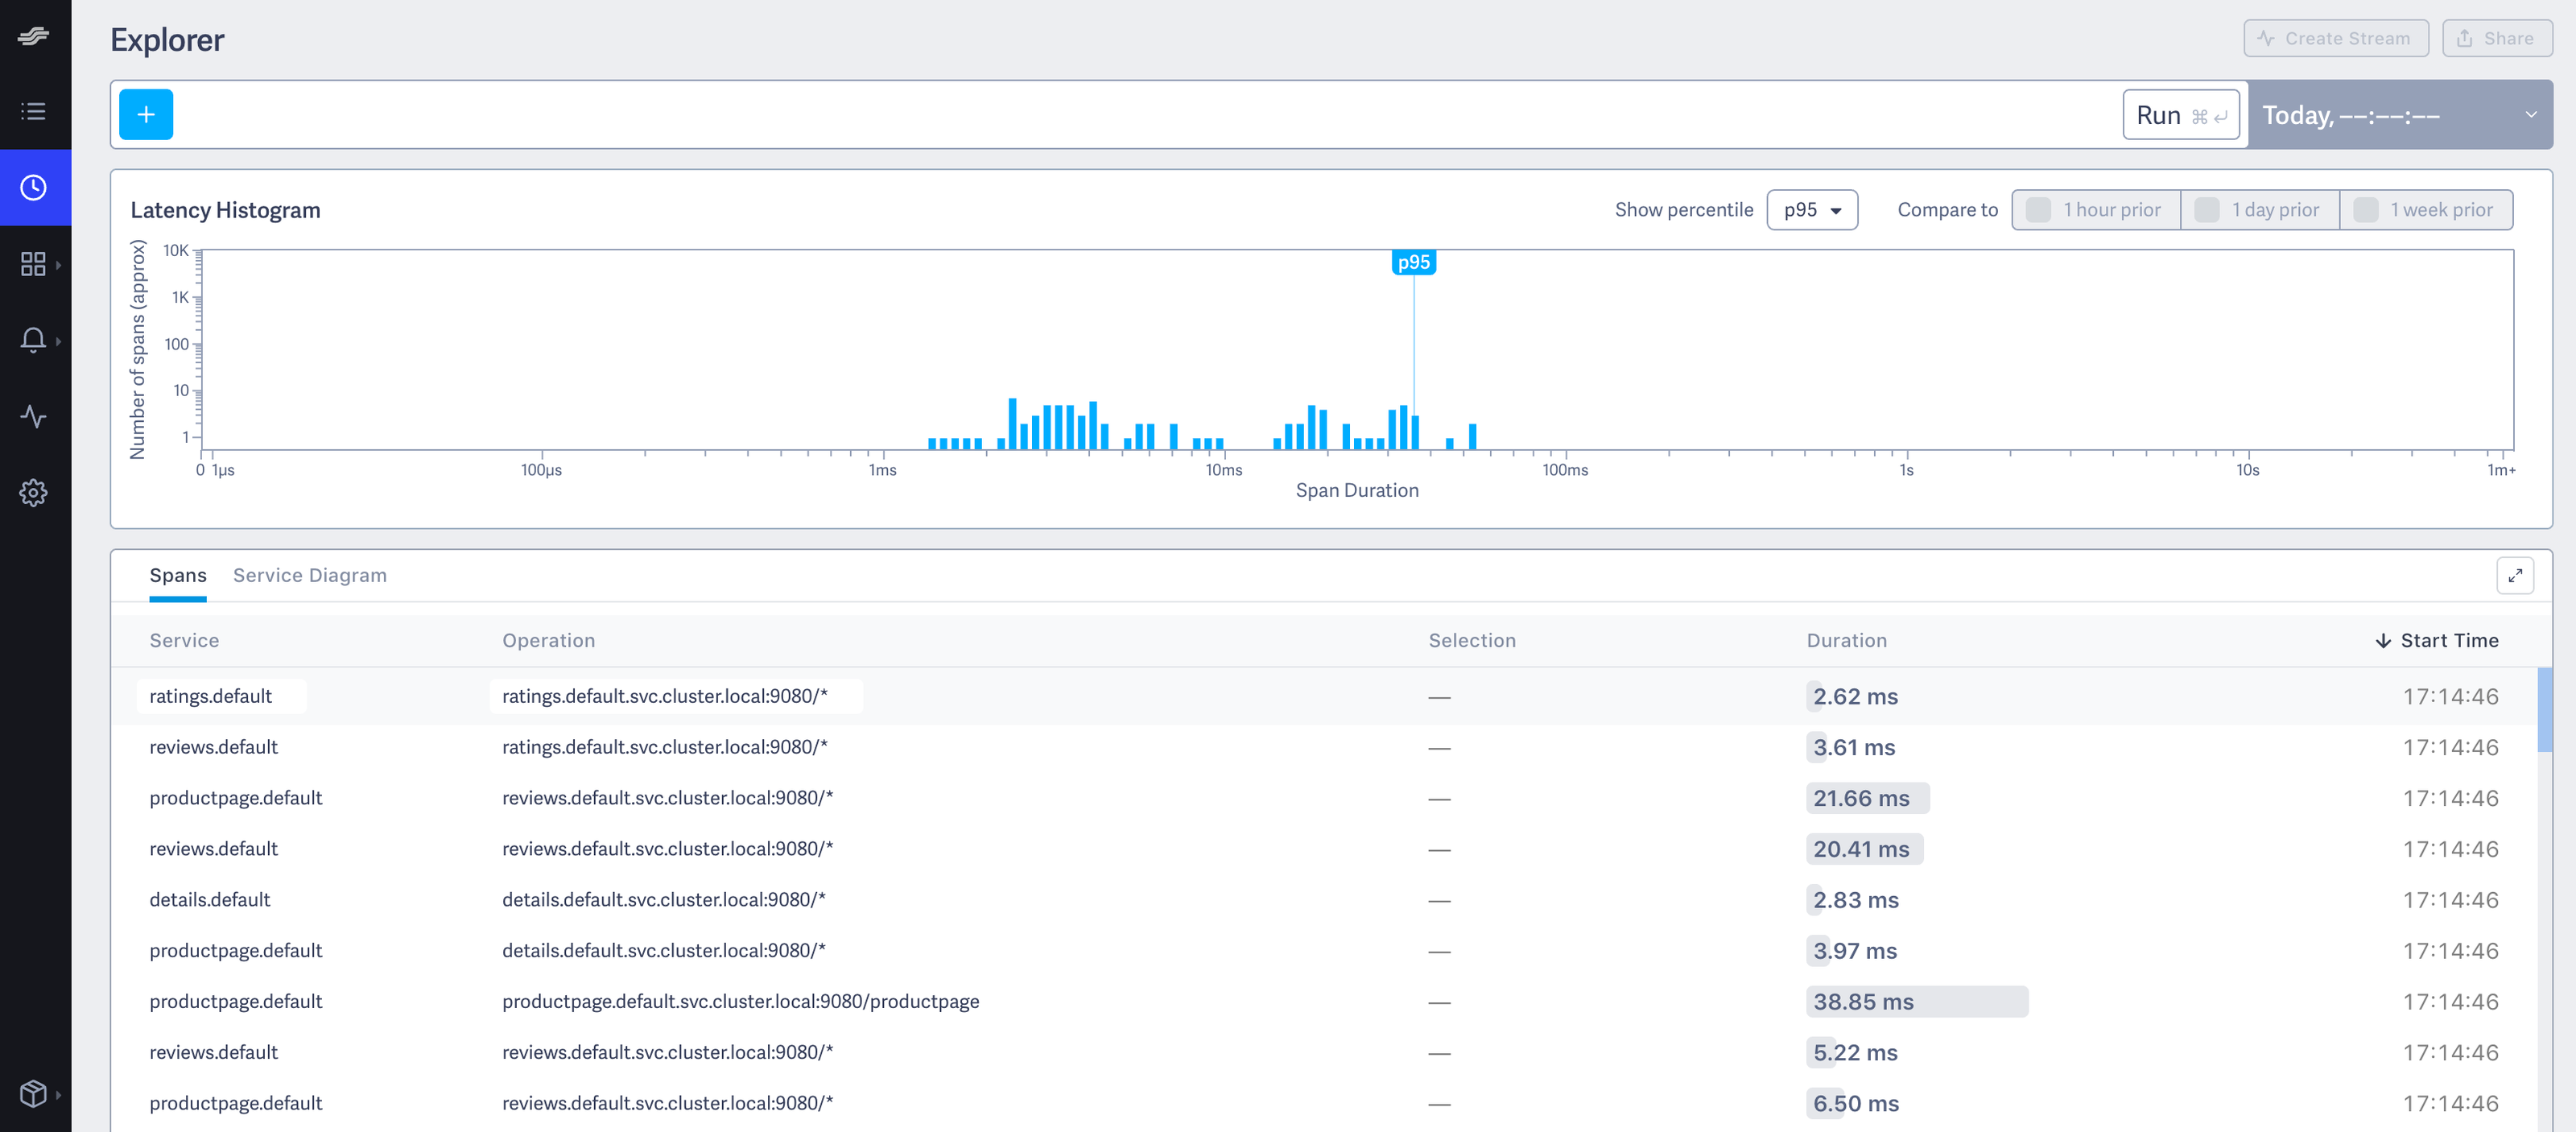
Click Run. You see something similar to the following:
Explorer
Click on the first row in the table of example traces below the latency histogram to see the details corresponding to your refresh of the
/productpage. The page then looks similar to: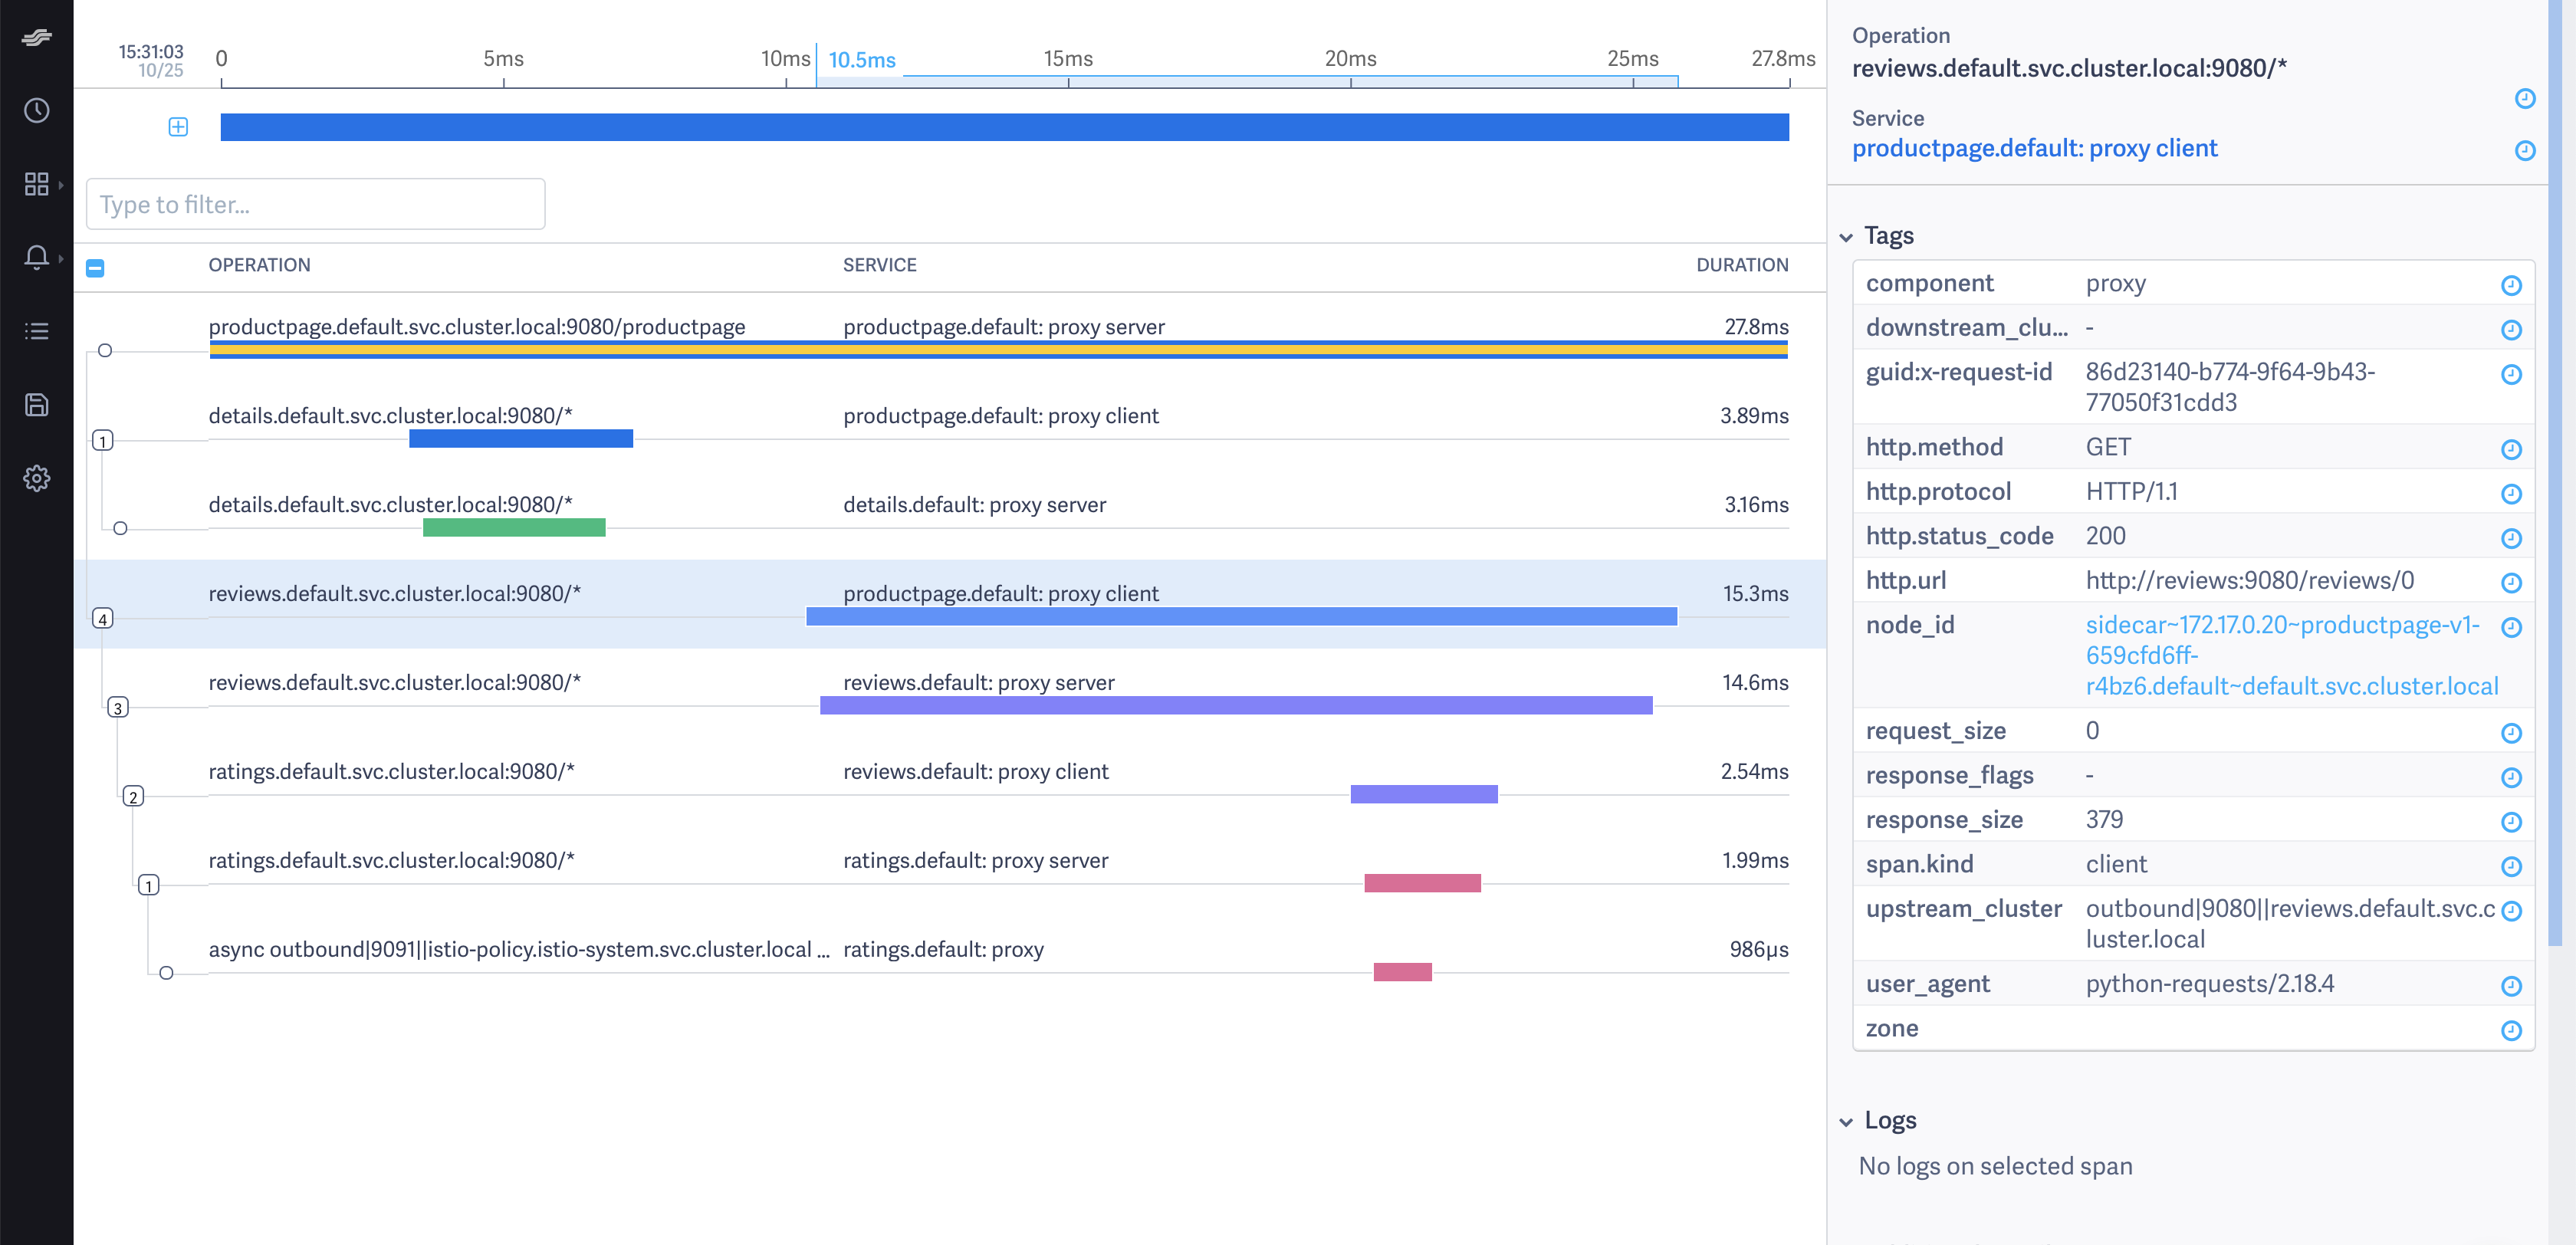
Detailed Trace View


The screenshot shows that the trace is comprised of a set of spans. Each span corresponds to a Bookinfo service invoked during the execution of a /productpage request.
Two spans in the trace represent every RPC. For example, the call from productpage to reviews starts with the span labeled with the reviews.default.svc.cluster.local:9080/* operation and the productpage.default: proxy client service. This service represents the client-side span of the call. The screenshot shows that the call took 15.30 ms. The second span is labeled with the reviews.default.svc.cluster.local:9080/* operation and the service. The second span is a child of the first span and represents the server-side span of the call. The screenshot shows that the call took 14.60 ms.
The Lightstep integration does not currently capture spans generated by Istio’s internal operation components such as Mixer.
Istio captures traces at a configurable trace sampling percentage. To learn how to modify the trace sampling percentage, visit the .
When using Lightstep, we do not recommend reducing the trace sampling percentage below 100%. To handle a high traffic mesh, consider scaling up the size of your satellite pool.
Cleanup
If you are not planning any follow-up tasks, remove the Bookinfo sample application and any Lightstep secrets from your cluster.
Remove the secret generated for Lightstep:
$ kubectl delete secret lightstep.cacert

